 Crash Injuries and Urban Roads
Most crash deaths occur on rural roads, but motorists drive 2 billion miles every day on urban arterial roads. About 8,000 deaths and more than 1 million injuries occur each year on these roads. The crashes aren't occurring haphazardly. Many of them happen in predictable locations and involve predictable sequences of contributing events. Remedies can involve costly and disruptive re-engineering of the roadways — but not always. Some relatively simple and inexpensive roadway changes can be effective.
"Urban arterials weren't built to accommodate today's heavy traffic. They've evolved as traffic has increased, and they haven't always evolved in the best way to enhance safety and ensure a smooth flow of traffic. So it's a matter of studying urban arterials to pinpoint where crashes are occurring frequently and then identifying potential solutions, looking first for less costly measures that can be implemented more quickly than major re-engineering," says Richard Retting, senior transportation engineer at the Insurance Institute for Highway Safety.
To demonstrate how to reduce crashes by applying less costly and complex measures, Retting led a project involving a major arterial in suburban Fairfax County, Virginia, near Washington, D.C. The researchers studied traffic on Leesburg Pike, identified problems that were causing crashes, and then applied measures like adding protected left-turn signals at problem intersections or moving a bus stop a few hundred feet. At two of the six locations where such measures were applied, crash types that had been overrepresented were reduced to zero. At four other intersections, the targeted crashes were significantly reduced.
SUMMARY OF IMPROVEMENTS
Average number of crashes per year before/after
application of simple, relatively inexpensive
crash reduction measures |
|
TARGETED
CRASH
TYPE |
BEFORE:
AVG. CRASHES
PER YEAR |
SOLUTION
APPLIED |
AFTER:
AVG. CRASHES
PER YEAR |
|
Left turn |
8.7 |
added protected turn signal |
0.0 |
|
Left turn |
4.6 |
added protected turn signal |
0.0 |
|
Rear end |
8.3 |
marked pavement w/arrows |
3.0 |
|
Rear end |
8.2 |
extended merge lane |
0.9 |
|
Rear end |
3.5 |
eliminated a bus stop |
1.4 |
|
Rear end |
4.3 |
widened shoulder
to allow bus stop |
2.5 |
Virginia Department of Transportation officials
worked closely with the researchers. VDOT's Connie Sorrell
says, "We applied some straightforward engineering
improvements that were effective and not very costly. We
are looking to use these and similar measures elsewhere."
Model for the nation: "We didn't set
out just to improve Leesburg Pike," Retting points
out. "We wanted to create a model for local officials
nationwide to improve safety and traffic flow in their own
areas. Officials can systematically study their arterials
and identify problems. They should seek remedies besides
the ones we've spelled out for Leesburg Pike because every
road is different."
How the project was conducted: Police crash
reports include a wealth of information about crash patterns.
Retting and his colleagues first gathered reports over 3
years on crashes that had occurred at 14 intersections along
6 miles of Leesburg Pike and sorted them by location. Next
the researchers classified the crashes by type (a vehicle
was struck by oncoming traffic during a left turn, a motorist
failed to heed a traffic signal and collided with another
vehicle, a motorist moved out of a travel lane and
collided
with another vehicle, or a stopped or very slowly moving
vehicle was struck in the rear). Where specific types of
crashes were clustered at particular intersections, the
researchers calculated the expected numbers of such crashes,
based on data from the whole arterial, to determine whether
a crash type was overrepresented. This revealed 6 problem
intersections where crashes of a specific type were occurring
more frequently than expected.
The researchers then inspected police crash reports and observed the six intersections where crashes were clustered tosee why the excessive crashes were occurring. Were rear-end crashes occurring because turning vehicles weren't adequately accommodated? Was the sight distance adequate to make a turn safely? Asking these kinds of questions led to identification of appropriate countermeasures.
"This is individualized work,"
Retting points out, "because crash types and circumstances
vary widely from one location to another, even along the
same road. You have to tailor your counter-measures to the
specific reasons the crashes are occurring."
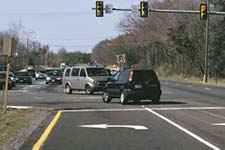
Results of simple and relatively inexpensive changes are dramatic: For example, westbound motorists on Leesburg Pike used to find it difficult to turn left across several lanes of heavy traffic at the intersection with Lewinsville Road. The speed limit for oncoming traffic is 45 mph, so vehicles often approach this intersection at relatively high speeds. To make matters worse, the view of oncoming traffic often is obscured by eastbound vehicles, especially trucks and buses waiting to turn left. These factors contributed to an overrepresentation of potentially serious side impacts involving left-turning vehicles.

|
 |
Annual
left-turn crashes before protected signal: average
4.6 |
After
left-turn signal was added: 0 |
Reducing these crashes didn't involve costly and complex solutions. The Virginia Department of Transportation installed a protected left-turn signal for westbound motorists and adjusted the timing of the signal light for better traffic flow.
The results are dramatic. Westbound motorists
at Lewinsville Road had been experiencing an annual average
of 4.6 left-turn crashes before the interventions. During
the next 31 months, not one such crash occurred. Similar
measures were applied at Ring Road, with equally dramatic
results — an average of 8.7 left-turn rashes before
the interventions were reduced to zero during the subsequent
two years.
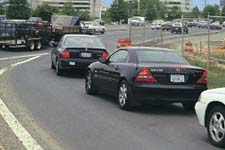
Other crashes were reduced by extending a
merge lane from Westpark Drive onto Leesburg Pike. This
reduced the queue of motorists waiting to merge and cut
rear-end crashes from an average of 8.2 crashes annually
before the merge lane was extended to 0.9 afterward.
 |
 |
Annual
rear-end crashes before merge lane extended: avg.
8.2 |
After
merge lane extended: 0.9 |
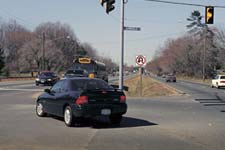
At the intersection of Leesburg Pike and Patterson Road,
rear-end crashes into stopped or stopping vehicles were
associated with a bus stop. Researchers took note of another
nearby bus stop and suggested eliminating the one at Patterson.
Once this stop was removed, rear-end crashes declined from
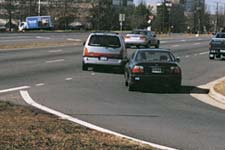
an average of 3.5 per year to 1.4. A similar improvement
was accomplished at Magarity Road by widening the shoulder
of Leesburg Pike two feet to accommodate buses. This way
bus drivers no longer have to stop in traffic and interrupt
the flow of vehicles. Rear-end crashes have declined from
4.3 per year to 2.5. (Source: IIHS)
|